OSX4005 Marine Vertebrates fieldtrip report, MSc Marine Biology, Bangor University. May 2018.
Preface
Two days at Point Lynas, on the north coast of Anglesey, in April 2018. The site was chosen because it has one of the highest rates of porpoise observation anywhere around the UK.
We worked in groups of three. Each group got an hour out on the Macoma, Bangor’s small research catamaran, counting porpoises; the rest of the time was spent on the headland watching seabirds. You were ferried out to the boat in an inflatable dinghy the handout called “small, some might say tiny.” Our group never made it onto the headland. The weather closed in.
The brief was 2,000 words, including references, captions and tables, answering one question: how does porpoise abundance relate to depth. We had to use every year of survey data the department had going back to 2011, not just our own, which meant the class collectively typing up years of scanned paper recording forms into a single file. Some years recorded position as degrees and decimal minutes, others as decimal degrees. Some of the forms were barely legible. The handout was blunt about it: “Learn from that and make sure you always record data completely and legible.”
Then map the tracks and sightings in ArcMap, pull depth off a bathymetry raster along each transect, work out sightings per unit effort, and regress one against the other.
The answer, if you want to skip ahead: porpoises were a bit more common in deeper water, and the result was not significant.
Introduction
Processes that determine the abundance and distribution of marine organisms is an important field of ecology (Redfern et al., 2006). Understanding how these organisms are distributed relative to habitat has important implications for their conservation and management (Shucksmith, Jones, Stoyle, Davies, & Dicks, 2009). The harbour porpoise Phocoena phocoena is widely distributed in cooler coastal waters throughout the North Atlantic, North Pacific and Black Sea (Figure 1) (Bjorge & Tolley, 2017; IUCN, 2008), and is one of the most frequently sighted cetacean species in UK waters (Goodwin & Speedie, 2008). They typically inhabit continental shelf waters, and frequent shallow bays, estuaries and tidal channels less than approximately 200 m depth (Caretta, Taylor, & Chivers, 2001). Although the harbour porpoise is listed as Least Concern by the IUCN, it is listed under Annex II and IV of the European Union Habitats Directive. This means their habitat must be managed in accordance to the species’ ecological needs (Annex II), and they are afforded strict protection prohibiting deliberate capture, killing or disturbance of this species (Annex IV).
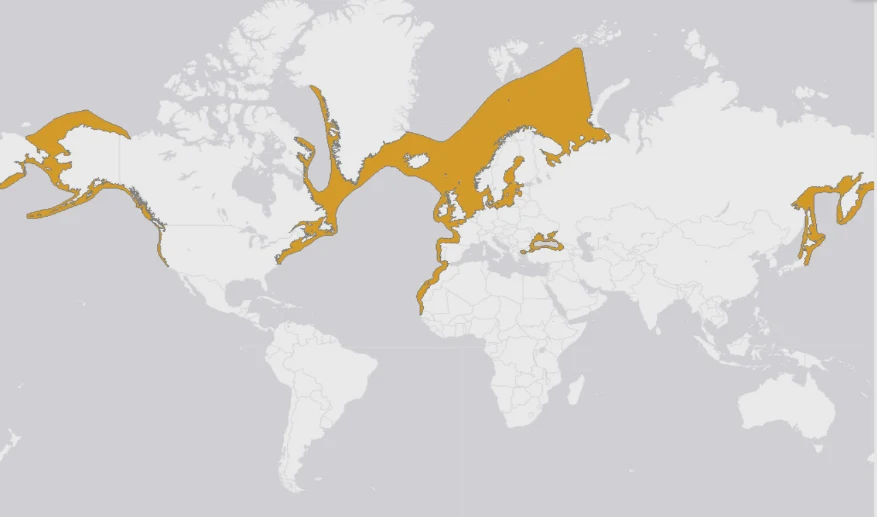
Figure 1. Global distribution of the harbour porpoise Phocoena phocoena. (IUCN, 2008)
There have been numerous surveys conducted over the past three decades assessing the abundance and distribution of cetaceans including the harbour porpoise around UK waters (e.g. see the Whale and Dolphin Conservation Society (WDCS), and Small Cetacean Abundance in the North Sea (SCANS). These surveys are becoming more important as they help scientists and managers understand where these organisms are likely to be distributed. With the rapid expansion of marine wind farms as governments strive to meet renewable energy commitments, there is likely to be growing conflict between cetaceans and humans (Madsen, Wahlberg, Tougaard, Lucke, & Tyack, 2006).
Bathymetry is known to impact cetacean distribution (Goodwin & Speedie, 2008; Macleod, Simmonds, & Murray, 2003). The purpose of this survey is to further our understanding of the abundance and distribution of harbour porpoises in UK waters. Specifically, we will test how harbour porpoise abundance and distribution relates to depth at Point Lynas, north of Anglesey, North Wales.
Materials and Methods
Site and survey design
The study area was located at Point Lynas located on the north side of Anglesey, North Wales (Figure 2). Anglesey is located in the Irish Sea and separated from the United Kingdom by the Menai Strait. The survey was conducted in April between the years 2012 and 2018 on board Bangor University’s 7.9 m research catamaran the Macoma. Data from 2017 was missing, therefore was not included in the analysis. A single platform survey methodology was used to collect data on cetacean sightings to determine species distribution and density. Observations were conducted by different teams over a one-hour period. The transects were defined by this one-hour interval, meaning each observation team represents a different transect. There was a minimum of four observers positioned on the boat to watch for cetaceans. Two were positioned on the port side, and another two on the starboard side. Both observers on each side scan an area covering 90° (making a total of 180°). One of the observers was positioned in the cabin to collect data and to allow for clearer observation from the front of the boat. When a cetacean is sighted, information such as species, number, certainty and angle from the boat is called to the data recorder. The boat cruises at a steady speed of <10 kn in different directions to cover a broad area around Point Lynas within the survey box (Figure 2). Every 10 minutes, the data recorder notes the time, boat position (degrees minutes), speed, sea state, swell and weather conditions. If the boat changes direction, then these metrics are also recorded.
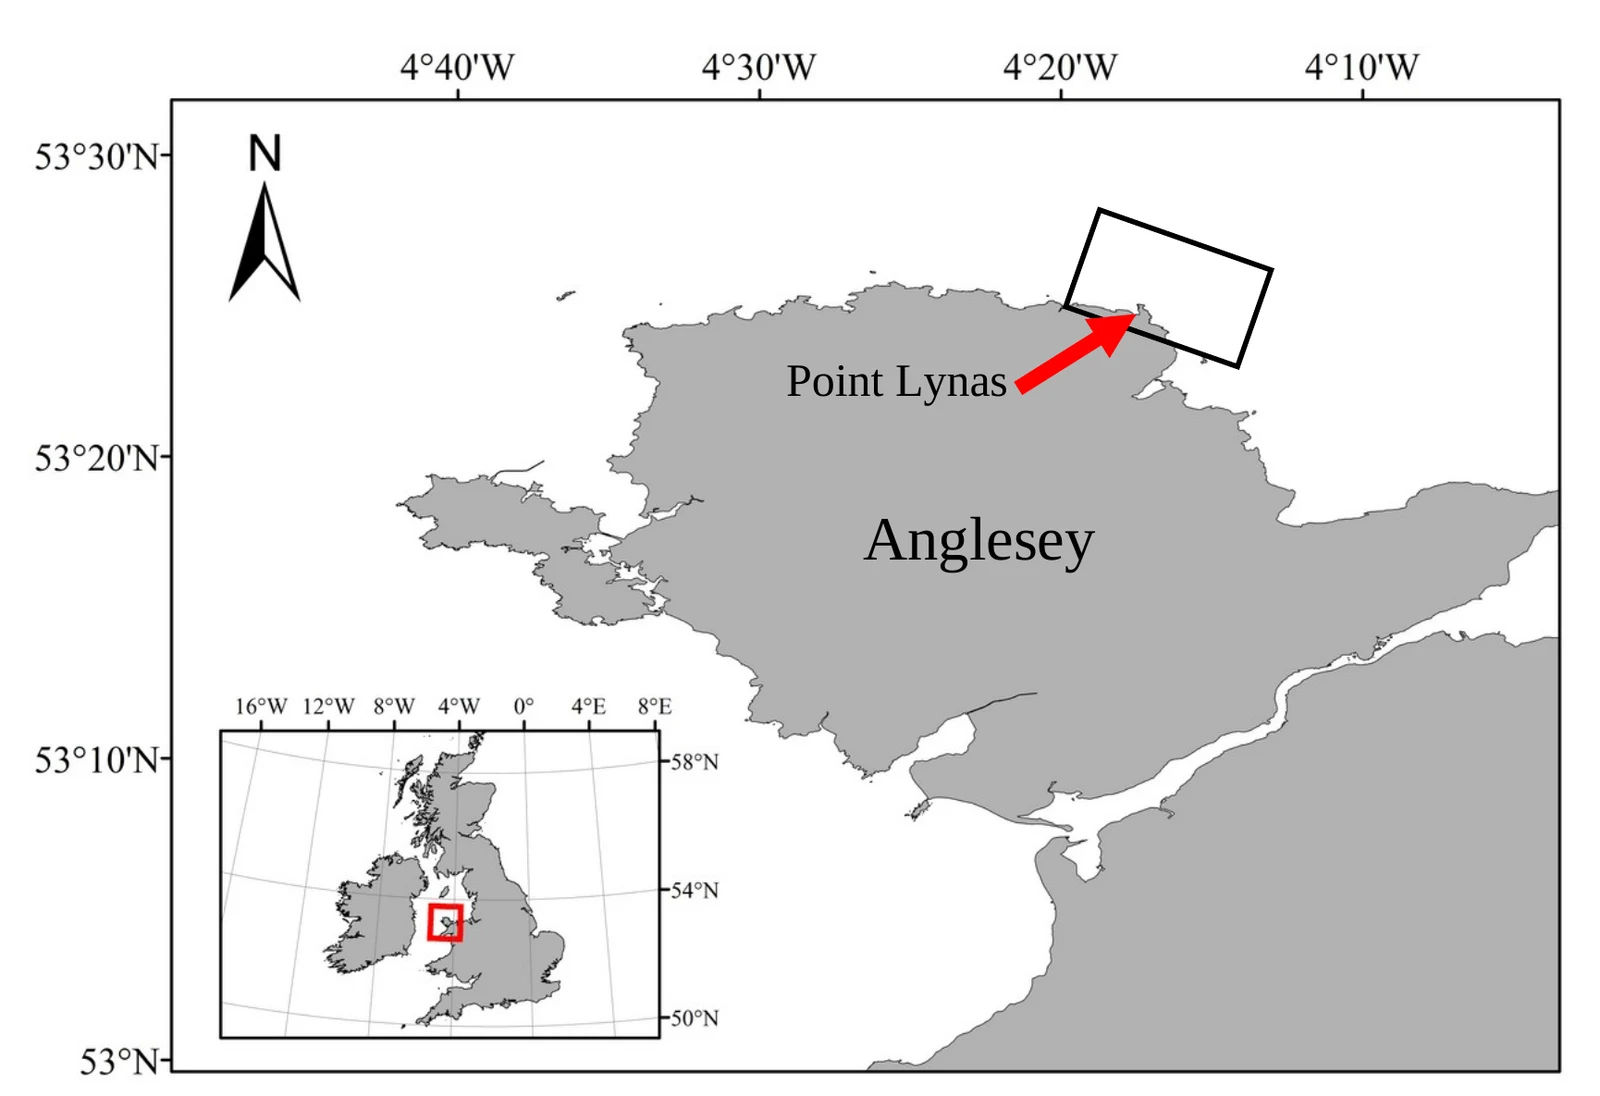
Figure 2. Study area on the north side of Anglesey, North Wales. The black box indicates the area the boat surveyed.
The other teams conducted a bird survey from the headland. Unfortunately, our team was unable to participate in this survey due to adverse weather conditions, so the methodology will not be described here. However, a chart of the species observed by the other teams was made and included in this report.
Bathymetric data was obtained from two sources. First, a high resolution bathymetric chart of the region around Point Lynas headland following the coastline was obtained from Bangor University. For the rest of the area, a lower resolution bathymetric chart was obtained from Digimaps (Figure 3).
Data analysis
The data for all years was collated and factored into roughly ~10-minute intervals. The distance the boat travelled within each ~10-minute interval was calculated from the latitude and longitude reading. The cetacean sightings for each ~10-minute interval were summed and divided by the distance to give Sightings Per Unit Effort (SPUE), where the unit of effort is defined as distance travelled in ~10 minutes of observation. Following this, cetacean sightings and boat trajectory were plotted in Arc GIS. Several points along each transect were generated using the Generate Points Along Lines tool in ArcGIS and the depths automatically extracted from the bathymetric charts. The mean value of the extracted depths for each transect was calculated and related to each ~10-minute interval. This allows for comparison of SPUE and depth to be made.
SPUE was square root transformed to minimise the skew and a linear regression was calculated against depth using SPSS.
Results
Location of sightings and total range covered by the Macoma between 2012 to 2018 can be visualised in Figure 3. The total number of sightings for each survey year are presented in Table 1. The year 2012 had the greatest number of sightings, whereas 2018 had the fewest. Data on weather condition for the previous year’s surveys was not available, however the weather in the 2018 survey was poor, thus affecting visibility and reducing chances of making a sighting.
Table 1. Total number of cetacean sightings for each year surveyed.
| Year | Total sightings |
|---|---|
| 2012 | 24 |
| 2013 | 9 |
| 2014 | 16 |
| 2015 | 8 |
| 2016 | 7 |
| 2018 | 4 |
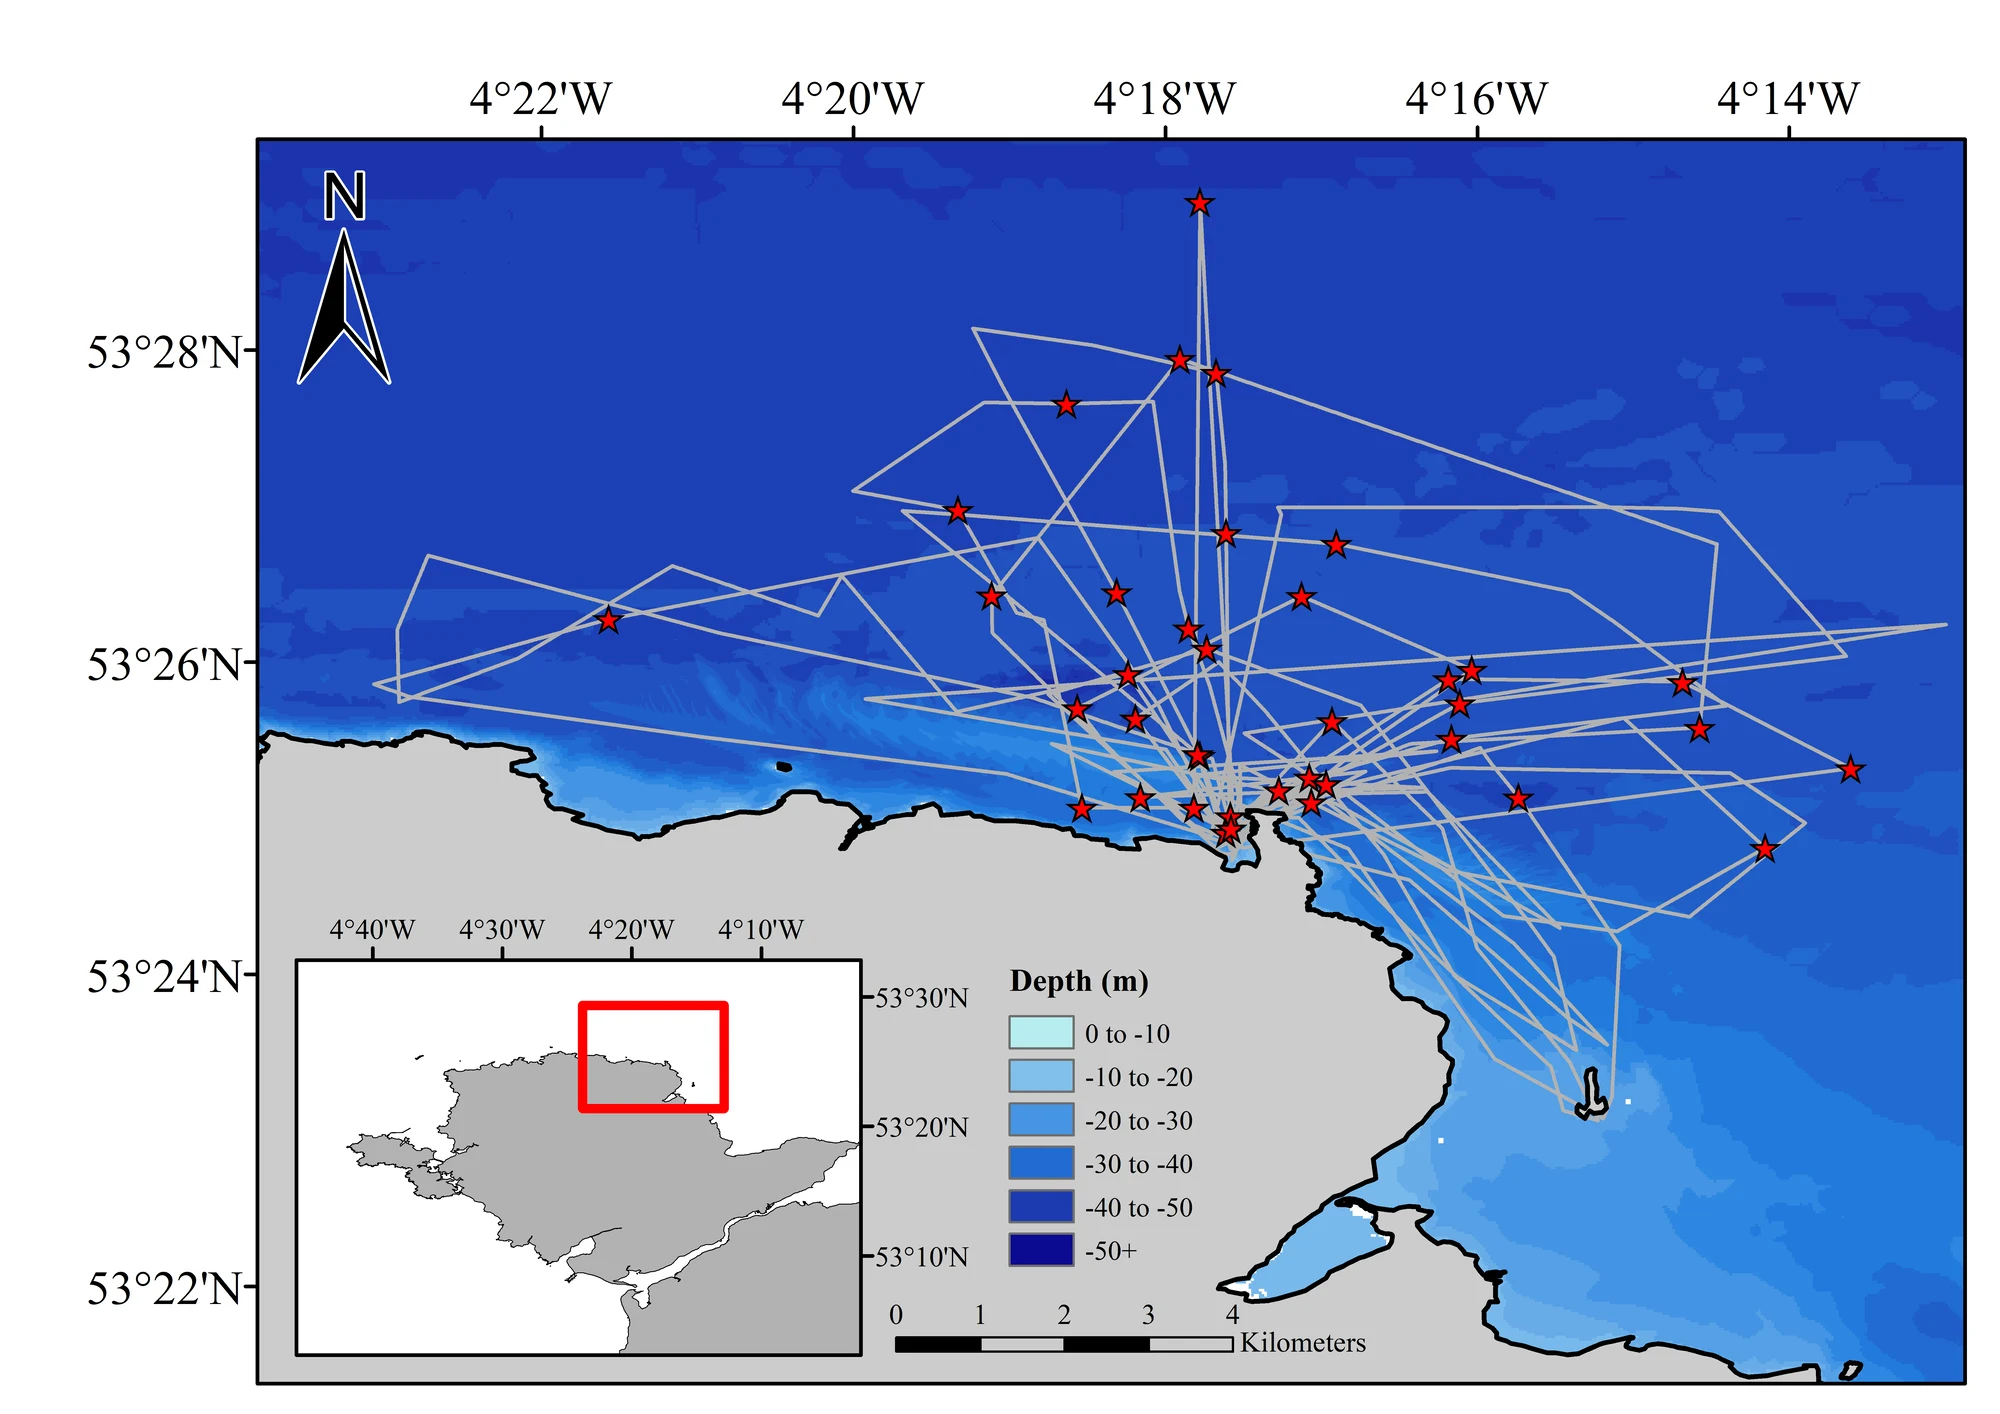
Figure 3. Sightings of cetaceans around Point Lynas, North Wales between 2012 and 2018. The grey line indicates the total extent of the area surveyed by the research vessel the Macoma, and the red stars indicate a sighting. Bathymetric data was obtained from Bangor University and Digimaps and was combined on this map.
Figure 4 gives a scatter plot of SPUE (square root transformed) against depth. SPUE tends to be slightly higher in deeper waters, however the result was not significant (r² = 0.027, n = 66, P = 0.183).
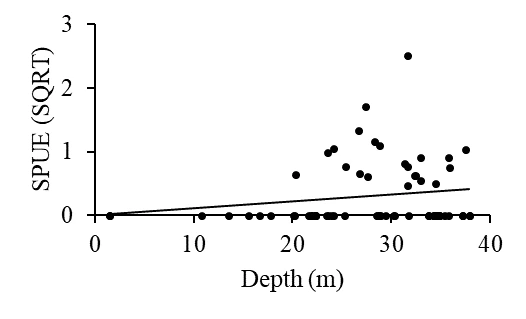
Figure 4. SPUE (square root) and depth between the years 2012 to 2018 at Point Lynas, North Wales.
Table 2 gives the marine birds and mammals observed from the headland with the total number of sightings combined for the period of observation. The number of sightings does not represent individuals spotted, rather is a culmination of number of times that species was observed over a period of time.
Table 2. Species observed from the headland with number of sightings for the study period for the 2018 survey at Point Lynas, North Wales.
| Species | Number of sightings |
|---|---|
| Porpoise | 32 |
| Herring gull | 31 |
| Shag | 26 |
| Gannet | 14 |
| Razor bill | 5 |
| Guillemot | 5 |
| Gull | 5 |
| Lesser blackback | 2 |
| Seal | 1 |
| Cormorant | 1 |
Discussion
It is clear from the results that Point Lynas is an important area for harbour porpoises, and the data presented here confirms the findings of previous surveys conducted in this region (Shucksmith et al., 2009). Results from the boat-based survey indicate harbour porpoises are slightly more likely to be spotted in deeper waters. The results were not significant, however this was probably a function of confounding variables and inconsistencies in data collection. Data from this survey does give a good indication of porpoise abundance for the spring months, however, this cannot be extrapolated for the whole year. It is likely harbour porpoise abundance fluctuates through the year (Weir, Stockin, & Pierce, 2007). Previous studies have observed a strong relationship between porpoise sightings and depth. For example, Goodwin & Speedie, (2008) found increased harbour porpoise sightings around the 100 m depth contour on the west coast of the UK. This is thought to be related to the distribution of harbour porpoise prey species (Hastie, Swift, Slesser, Thompson, & Turrell, 2005).
Renewable energy development and recreational activity around the north Anglesey area are the most likely sources of disturbance for harbour porpoises. Artificial sound from engines or turbines can be carried many kilometres away. It is believed that many cetacean species, including the harbour porpoise, are particularly sensitive to the low frequencies emitted from these machines, and may interfere with their inbuilt navigation system (Carstensen, Henriksen, & Teilmann, 2006; Johnston, 2002). Surveys that aim to understand the distribution of cetaceans and how this relates to their habitat can better inform managers to take appropriate action to ensure disturbance to populations is minimised. For example, there is increased recreational activity around Point Lynas during the summer months, and unfortunately this coincides with critical feeding and nursery season for this species (Shucksmith et al., 2009). Better understanding of cetacean distribution and habitat use enables managers to take measures to ensure the protection of this species during these critical times.
References
Bjorge, A., & Tolley, K. A. (2017). Harbor porpoise Phocoena phocoena. In Encyclopedia of Marine Mammals (3rd ed., pp. 530–532). Academic Press.
Caretta, J., Taylor, B., & Chivers, S. (2001). Abundance and depth distribution of harbor porpoise (Phocoena phocoena) in northern California determined from a 1995 ship survey. Fishery Bulletin, 99(1), 29–39.
Carstensen, J., Henriksen, O. D., & Teilmann, J. (2006). Impacts of offshore wind farm construction on harbour porpoises: Acoustic monitoring of echolocation activity using porpoise detectors (T-PODs). Marine Ecology Progress Series, 321, 295–308. https://doi.org/10.3354/meps321295
Goodwin, L., & Speedie, C. (2008). Relative abundance, density and distribution of the harbour porpoise (Phocoena phocoena) along the west coast of the UK. Journal of the Marine Biological Association of the United Kingdom, 88(6), 1221–1228. https://doi.org/10.1017/S0025315408001173
Hastie, G. D., Swift, R. J., Slesser, G., Thompson, P. M., & Turrell, W. R. (2005). Environmental models for predicting oceanic dolphin habitat in the Northeast Atlantic. ICES Journal of Marine Science, 62(4), 760–770. https://doi.org/10.1016/j.icesjms.2005.02.004
IUCN. (2008). Phocoena phocoena. www.iucn.org
Johnston, D. W. (2002). The effect of acoustic harassment devices on harbour porpoises (Phocoena phocoena) in the Bay of Fundy, Canada. Biological Conservation, 108(1), 113–118. https://doi.org/10.1016/S0006-3207(02)00099-X
Macleod, K., Simmonds, M. P., & Murray, E. (2003). Summer distribution and relative abundance of cetacean populations off north-west Scotland. J. Mar. Biol. Ass. U.K., 83, 1187–1192.
Madsen, P. T., Wahlberg, M., Tougaard, J., Lucke, K., & Tyack, P. L. (2006). Wind turbine underwater noise and marine mammals: Implications of current knowledge and data needs. Marine Ecology Progress Series, 309(Tyack 1998), 279–295. https://doi.org/10.3354/meps309279
Redfern, J. V, Ferguson, M. C., Becker, E. A., Hyrenbach, K. D., Good, C., Barlow, J., Werner, F. (2006). Techniques for cetacean - habitat modeling. Marine Ecology Progress Series, 310, 271–295. https://doi.org/10.3354/meps310271
Shucksmith, R., Jones, N. H., Stoyle, G. W., Davies, A., & Dicks, E. F. (2009). Abundance and distribution of the harbour porpoise (Phocoena phocoena) on the north coast of Anglesey, Wales, UK. Journal of the Marine Biological Association of the United Kingdom, 89(5), 1051–1058. https://doi.org/10.1017/S0025315408002579
Weir, C. R., Stockin, K. A., & Pierce, G. J. (2007). Spatial and temporal trends in the distribution of harbour porpoises, white-beaked dolphins and minke whales off Aberdeenshire (UK), north-western North Sea. Journal of the Marine Biological Association of the United Kingdom, 87(1), 327–338. https://doi.org/10.1017/S0025315407052721
Whale and Dolphin Conservation Society (WDCS). (2004). Cetaceans and Pelagic Trawl Fisheries in the Western Approaches of the English Channel. Summary Report of The 2004-2005 WDCS/Greenpeace Winter Surveys: A WDCS Science Report.